Help for View/Export Extended Data/Results
With this function you can visualize/export parameters/images/interferograms in SARPROZ.
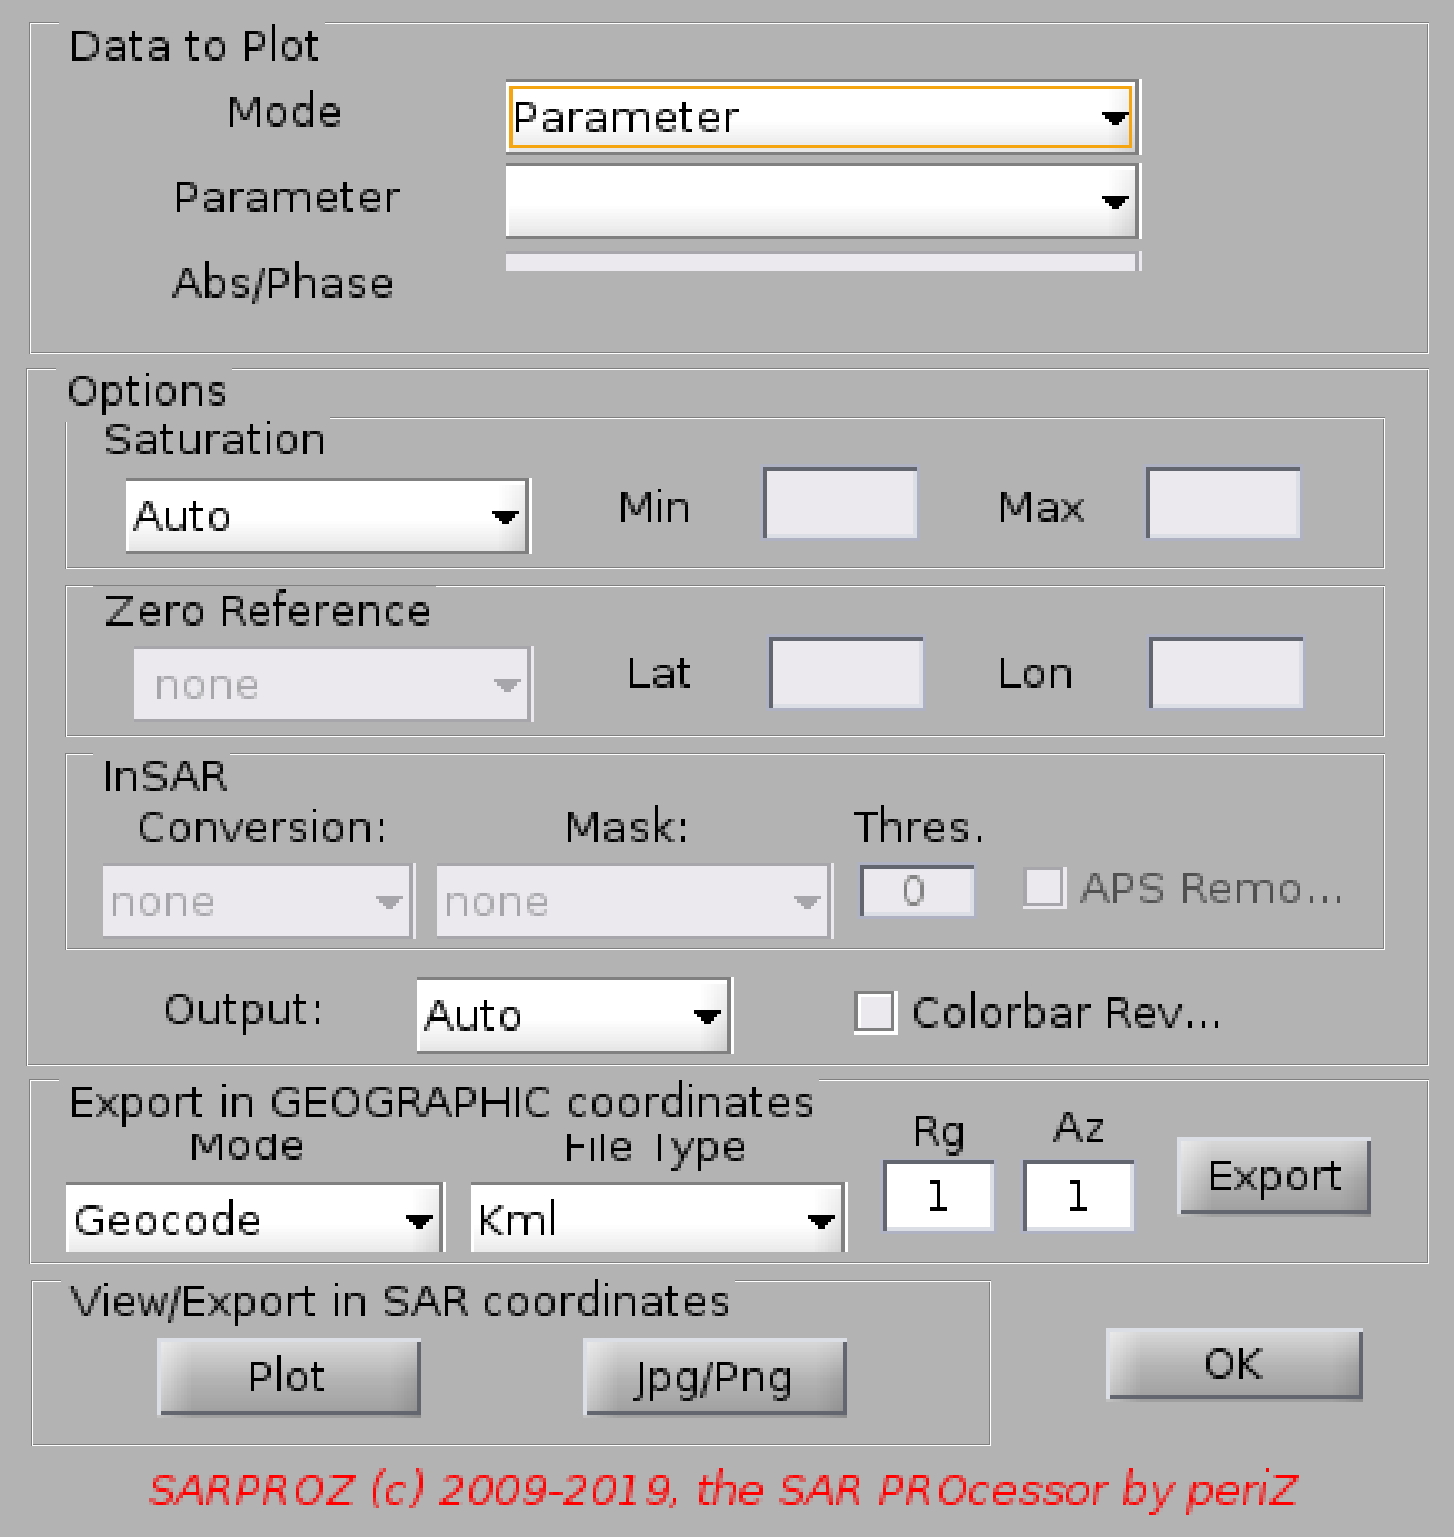
You have 5 modes of oepration:
- Parameters (to select and display single parameters one by one)
- Single Image (to select and display images manually one by one)
- Series of Images (to display all images in a sequential way)
- Single Interferogram (to select and display interferograms manually one by one)
- Series of Interferograms (to display all interferograms in a sequential way)
Depending on your choice, you have some additional options:
saturation (min/max), zero reference (the point to set to zero), color/black and white.
For interferograms, you can convert the phase to height or velocity and even remove the APS.
You can either plot the data above or export them
Exporting options:
- geocode/orthorectify (the first just takes a jpeg and rotates it. the second, resample the image correcting also the geometric distortions using a DEM)
- kml/geotiff RGB (uint8 values)/geotiff 32 (floating point values).
- range/azimuth downsampling (default: 1,1 which means no downsampling)
IMPORTANT
In Sarproz JPEG images are generated to display in a quick and light form full matrixes
(e.g. the amplitude of each image, interferometric coherence/phase, some parameters as reflectivity map, coherence map, external DEM height,
synthetic amplitude, amplitude stability index, ...).
JPEG images do not contain the orginal values, they are rescaled to 0-255 (uint8) range.
If you plot any of the full matrixes listed above with automatic options, JPEG data will be loaded and displayed.
This is faster and lighter but not flexible.
If you change options (your rescale or convert and so on), the software will load the original data, manipulate it and plot it.
This is more powerful, but it requires RAM and processing power. If your computer has limited RAM and the SAR images are big, you will get OUT of MEMORY problems.
You can check if JPEG or original data are displayed by selecting the figure "Data Cursor" tool and by clicking on pixels: if Index values are real, original
data is displayed. If Index values are uint8 (integers in the range 0-255), then the JPEG image is displayed.
For the full list of parameters that you can visualize, look at "Load Mask".
Parameters are here plotted in a matrix form in SAR coordinates.
For plotting parameters on a point basis, look at "Scatter Plots".