Help for View Parameters
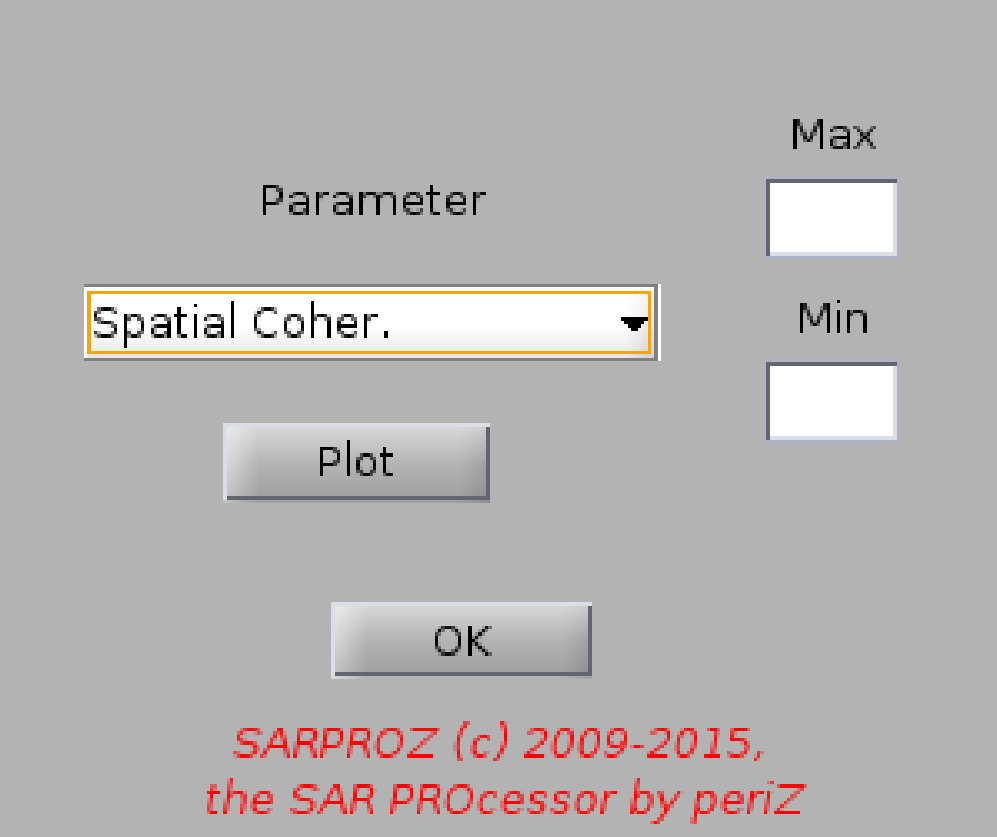
With this function you can visualize parameters in SARPROZ.
For the full list of parameters that you can visualize, look at "Load Mask".
Parameters are here plotted in a matrix form.
For plotting parameters on a point basis, look at "Scatter Plots".
You can choose the saturation interval through the values "Min" and "Max".