Help for Custom Mask Generation
With this module you can create custom masks for chosing the areas you want to include/exclude in the processing.
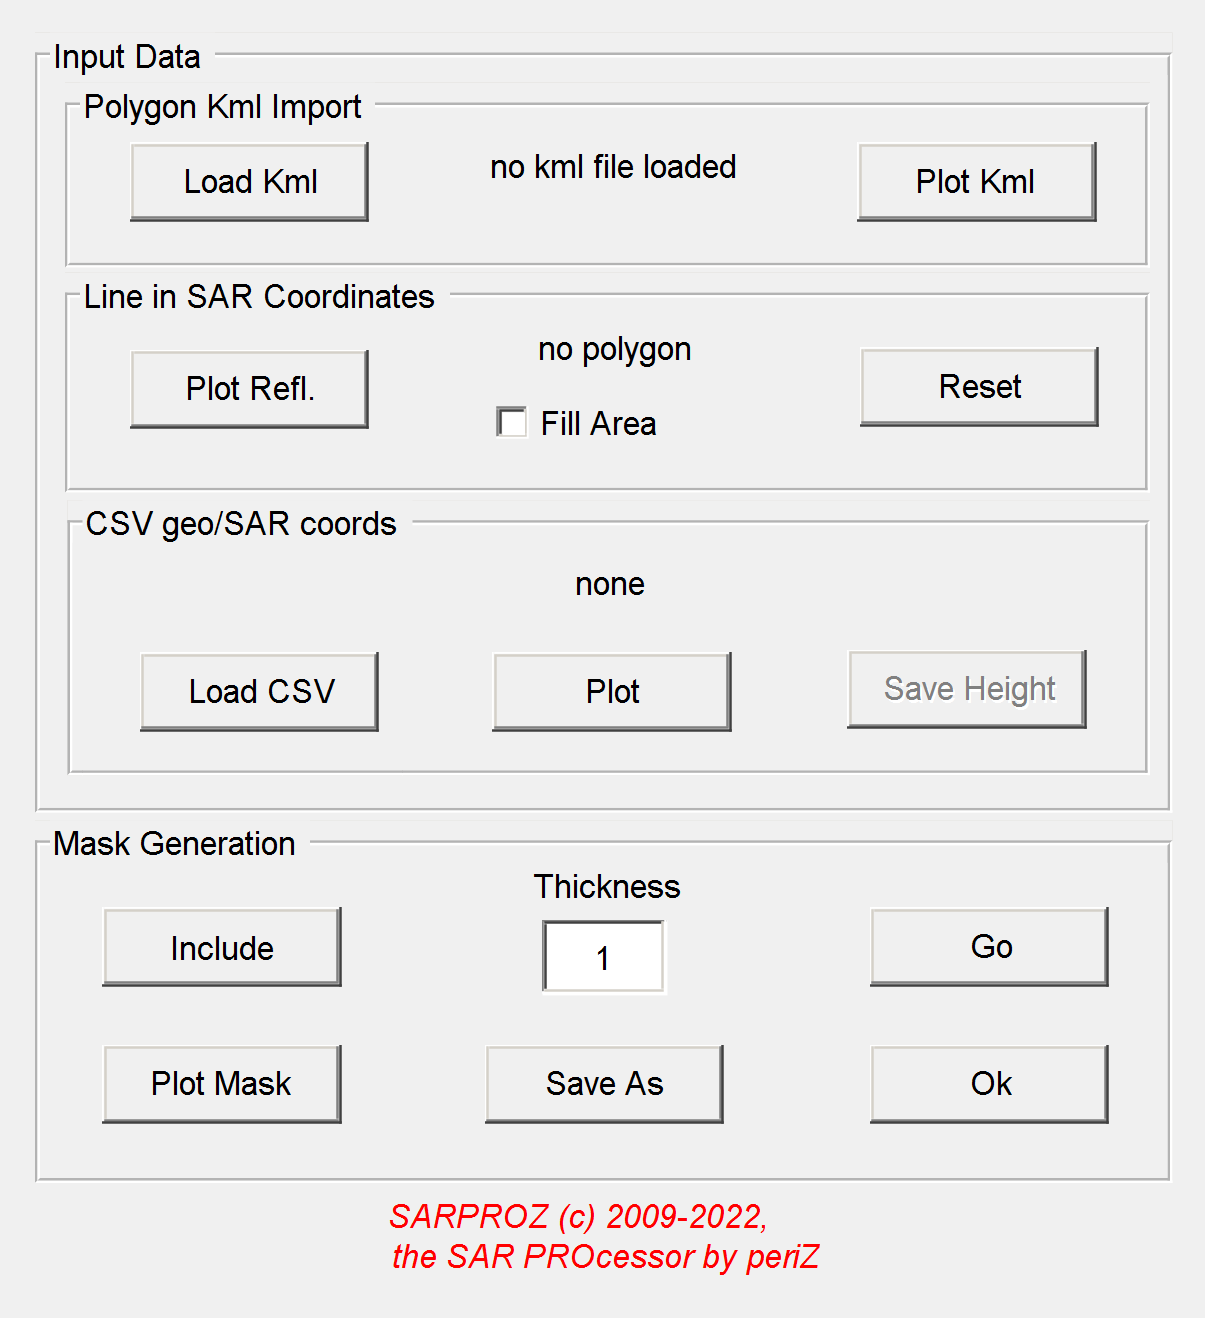
You have 3 ways to creat masks:
1. by importing kml polygons or lines
2. by drawing polygons or lines in SAR coordinates
3. by importing a list of geographic or SAR coordinates from a csv file.
1. importing kml polygons or lines
* create a kml file in google (like a polygon or a line)
* load the file using the corresponding button (note: it must have a kml extension, not kmz!)
* plot it and check it
* use the mask generation functions (see below)
2. drawing polygons or lines in SAR coordinates
* plot the reflectivity map
* Left click to draw your line point by point on the reflectivity map. Right click to exit
* choose whether you want to fill the area or not (within a polygon or in the inner region of a line)
* use the button reset to replace a previously created polygon/line
* use the mask generation functions (see below)
3. importing a list of geographic or SAR coordinates from a csv file.
* prepare a file with a list of coordinates. the files needs to be a text file, csv extension, without headers
the file should contain a table of numbers with 2 or 3 columns, each row representing a point
first two numbers in each row are either geographic (latitude/longitude) or SAR (samples/lines i.e. range/azimuth) coordinates
third column is optional and should contain height values
* after importing the csv file, you can plot it
* if your data contain also height information, you can save it
* use the mask generation functions (see below)
++ mask generation functions
* independently from the way in which you created the mask, in this section you can finalize the mask, plot it and save it
* you can decide whether your selection of pixels should be included or excluded from the mask
* you can choose the thickness of the mask (useful in case your mask is just a line and you want to select nearby pixels)
* with the button "go" you generate the mask
* you can plot it using "plot mask"
* you can save it by giving it an appropriate name with the button "save as"
After creating your custom mask, you can load it in any module of the software (choose a real file and browse for it).
Be aware that the software always uses as pre-selection the mask created at the very beginning (local maxima by default).
To skip the pre-selected mask, run the corresponding function in the "preliminary analysis" section and choose "all points (no mask)".