Help for Histograms
With this function you can plot histograms of all parameters managed by SARPROZ.
For the full list of parameters managed by SARPROZ, look at "Load Mask".
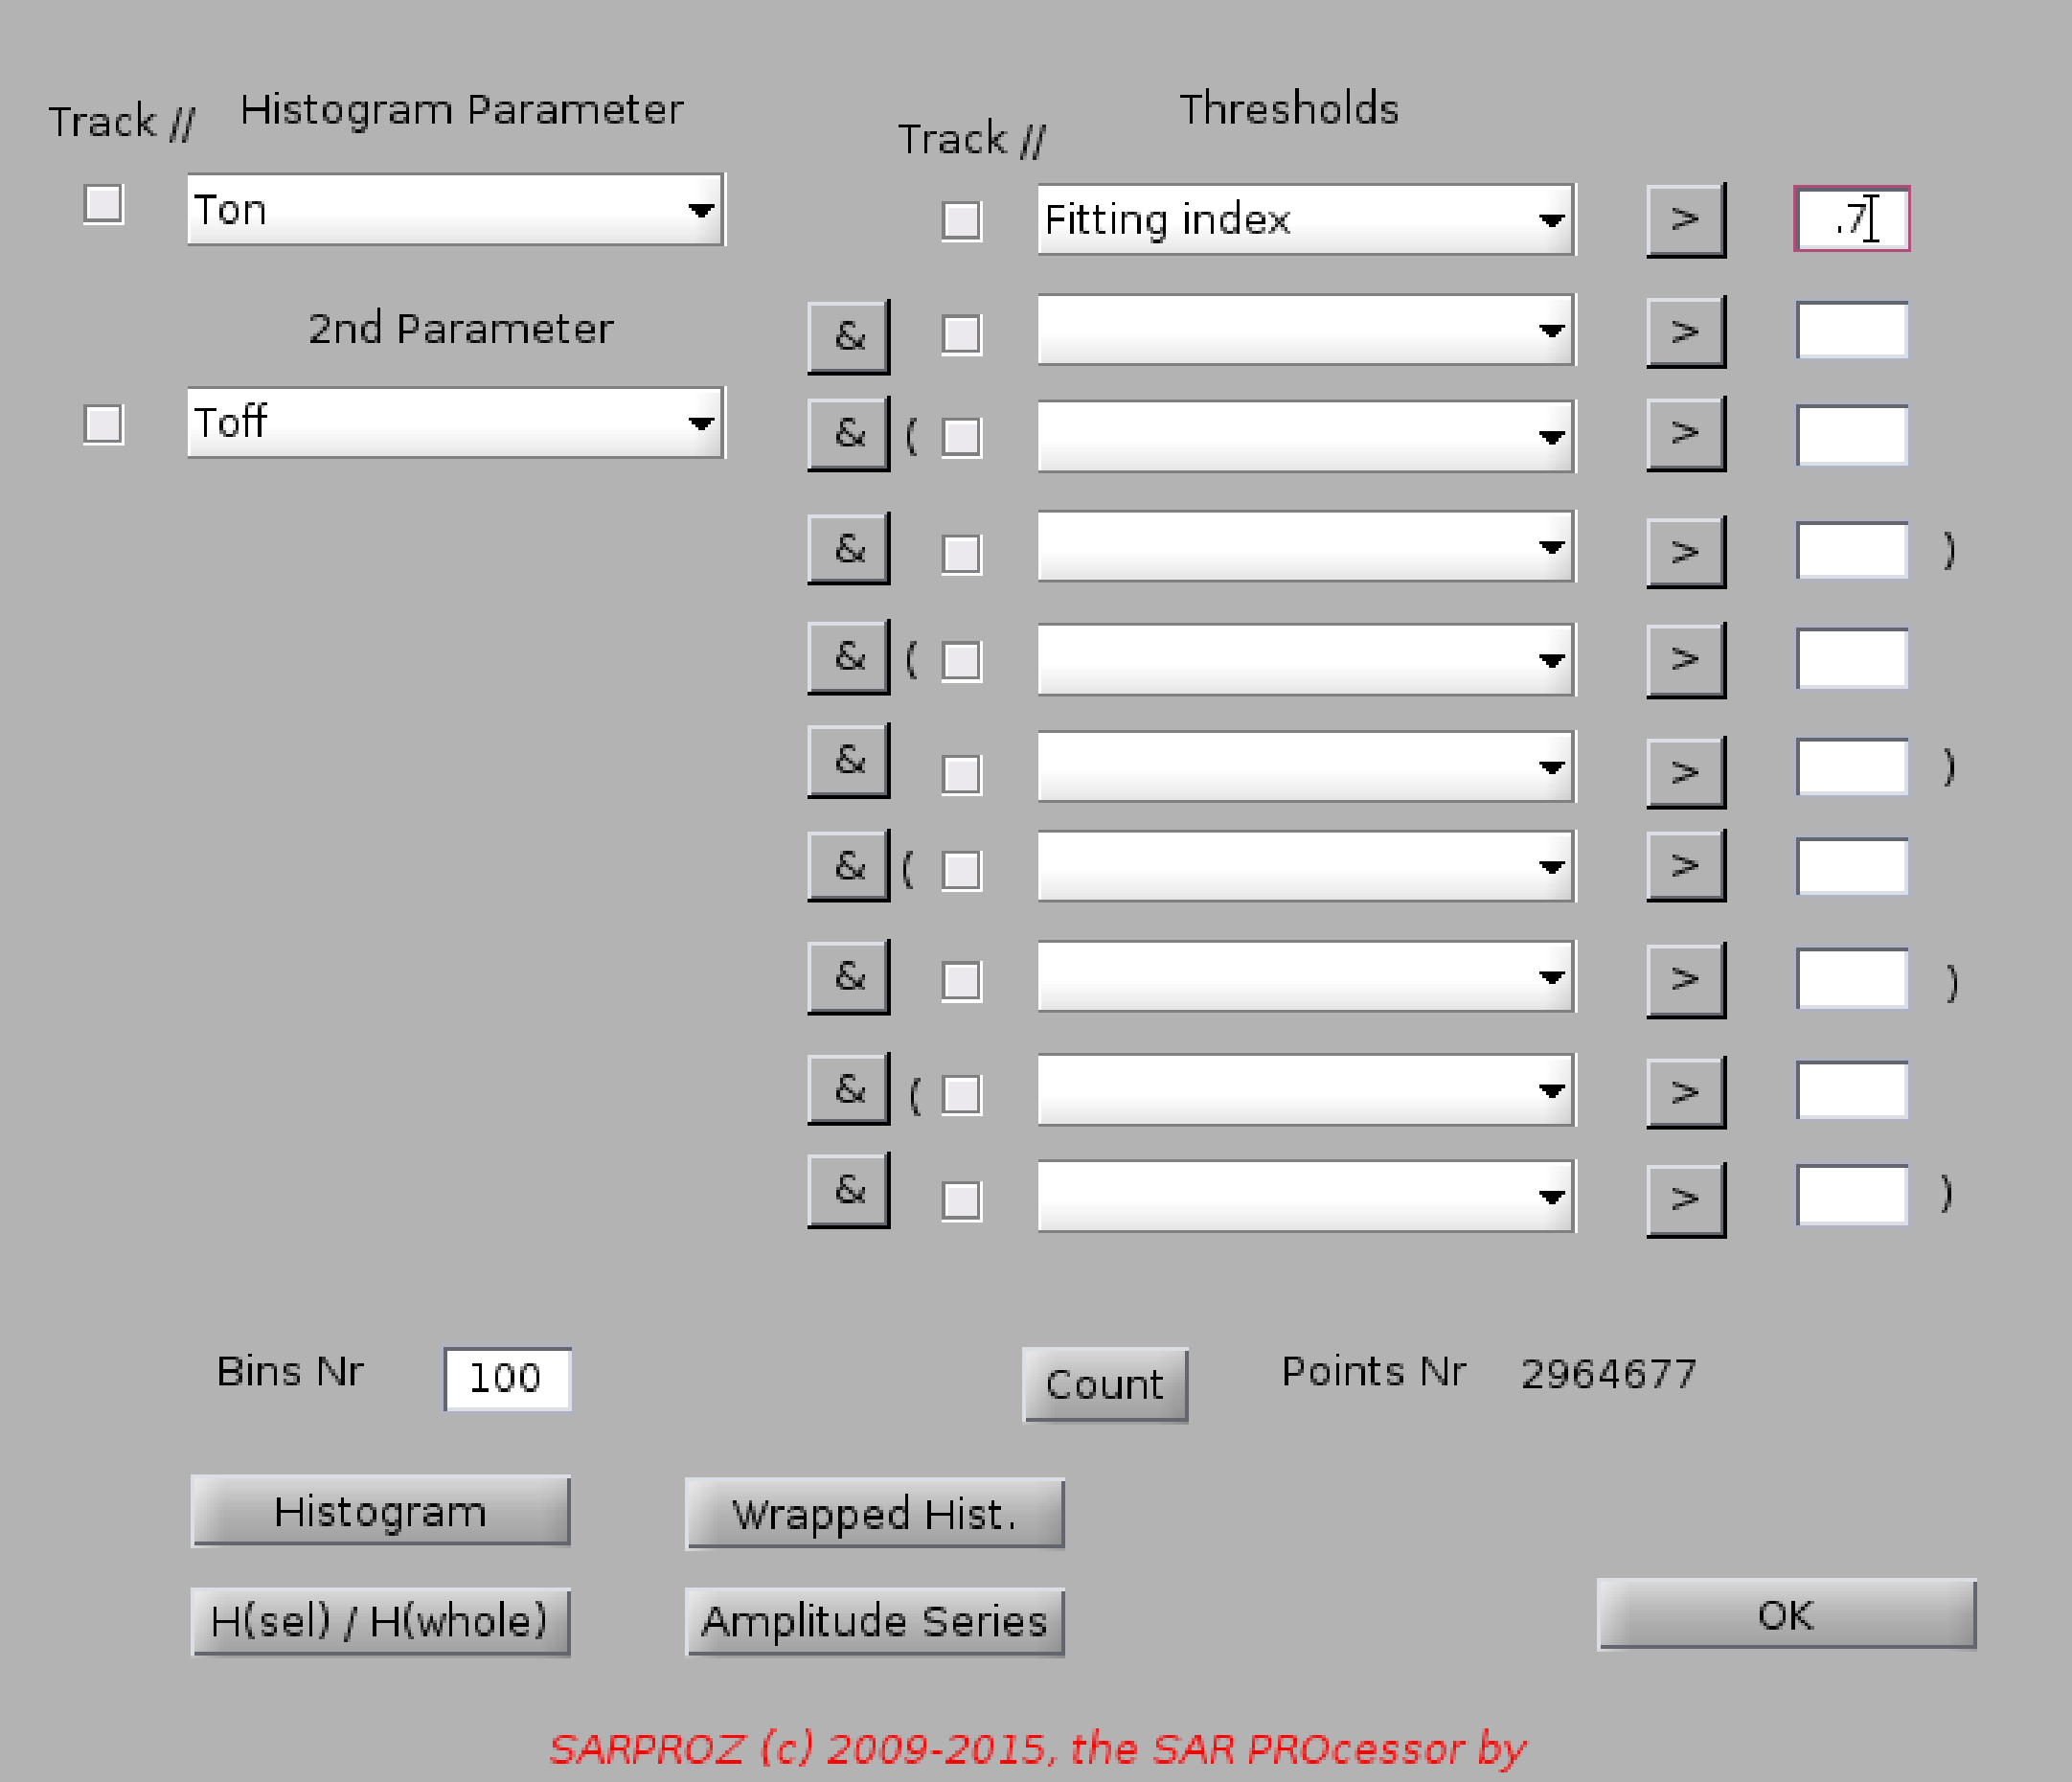
Select a parameter and press "Histogram".
To change the number of bins, specify the desired value in "Bins Nr".
You can plot till 2 parameters at a time, by choosing "2nd Parameter".
You can choose a subset of points for the histogram visualization
by filling the boolean selection conditions in the right columns.
Example of condition:
"Temporal coherence" > .8 & "Residual Height" < 20
In this way, all points with temporal coherence over .8 and residual height lower than 20
will be selected.
Press "Count" to apply the conditions. The number of selected points will be displayed.
By clicking on the corresponding signs, you can switch between and "&" and or "|" operators.
Note that there are pre-ordered brackets to group conditions.
Wrapped histograms can be plotted as well with a pie chart (clearly, this option has a meaning
when the parameter to be visualized is a phase).
Also a "relative" histogram can be displayed, showing the fraction between points selected with the above
conditions and the whole for each histogram bin.
Finally, to support the amplitude time series analysis, an options has been included to display
amplitude time series one by one for each point of the applied selection.