Help for InSAR Analysis module
In this module, you can perform the basic functions for InSAR processing.
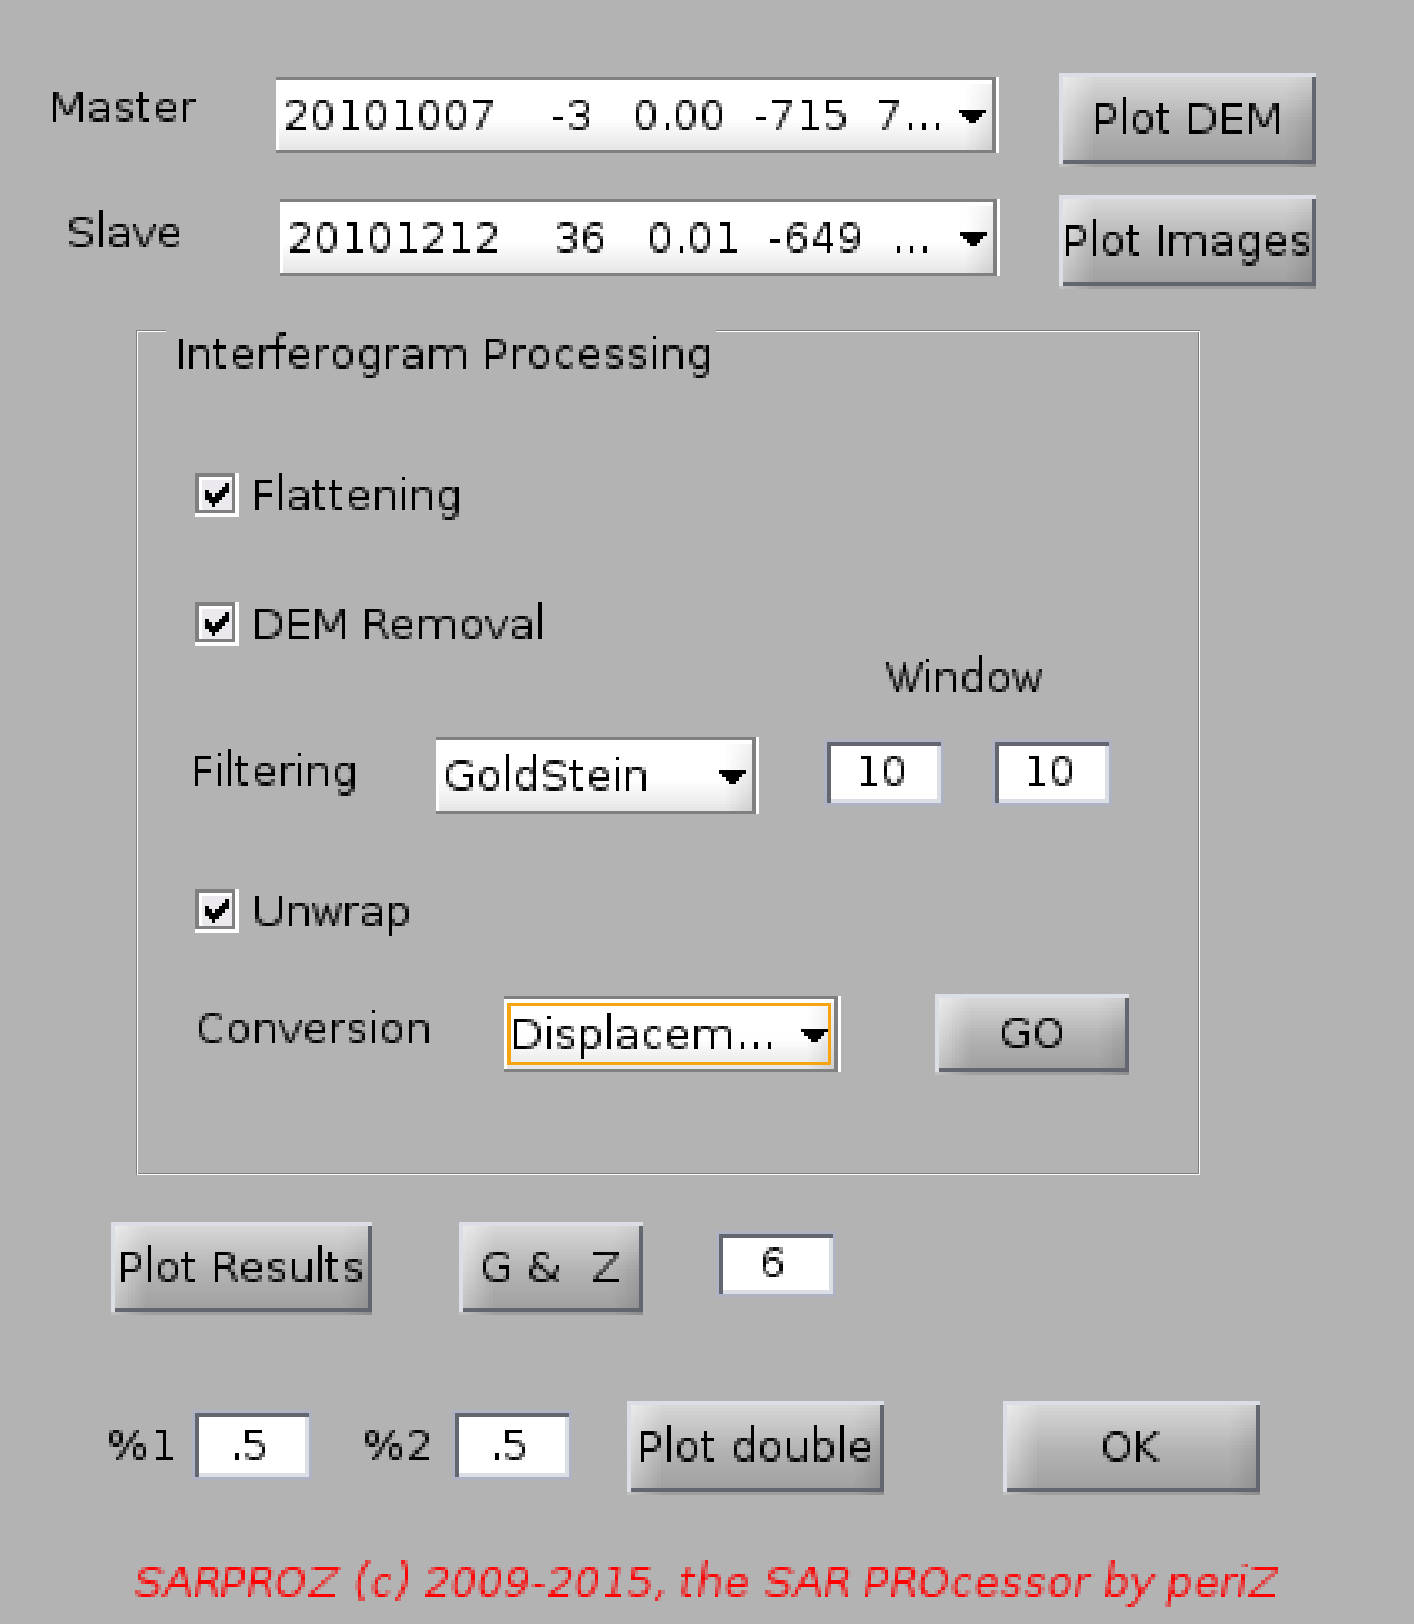
Firstly, select Master and Slave images by clicking the corresponding menu.
Note that for each image a list of parameters is shown.
In sequence: image date, Normal Baseline, Doppler Centroid, Temporal Baseline,
a number identifying the Sensor, Temperature.
By clicking "Plot Images", you can visualize amplitude and phase of the corresponding pair.
With "Plot DEM" you can see the DEM in the selected area.
Choose the operations to perform on the selected images pair:
-Flat terrain phase term removal
-Topographic phase term removal removal
-Filtering (at the moment you can choose among BoxCar, modified Goldstein, median),
for which you can specify the window size
-Unwrapping
-Phase conversion (into m -topography- or mm -displacement-).
Then click "GO" and the selected operations will be applied
You can then see the interferogram, coherence image and histogram by means of "Plot Results".
"G & Z" stays for Grab and Zoom. If you are looking at some details in the interferogram
(shown in Figure 6), write "6" beside "G & Z" and click it: all open images will be zoomed
on the same details.
"Plot Double" shows the colored interferometric phase superimposed on the interferogram
amplitude (black and white). You can choose a percentage of transparency of both values.