Help for Time Series Module
In this module you can visualize and export time series using the results processed by the MISP and APS modules.
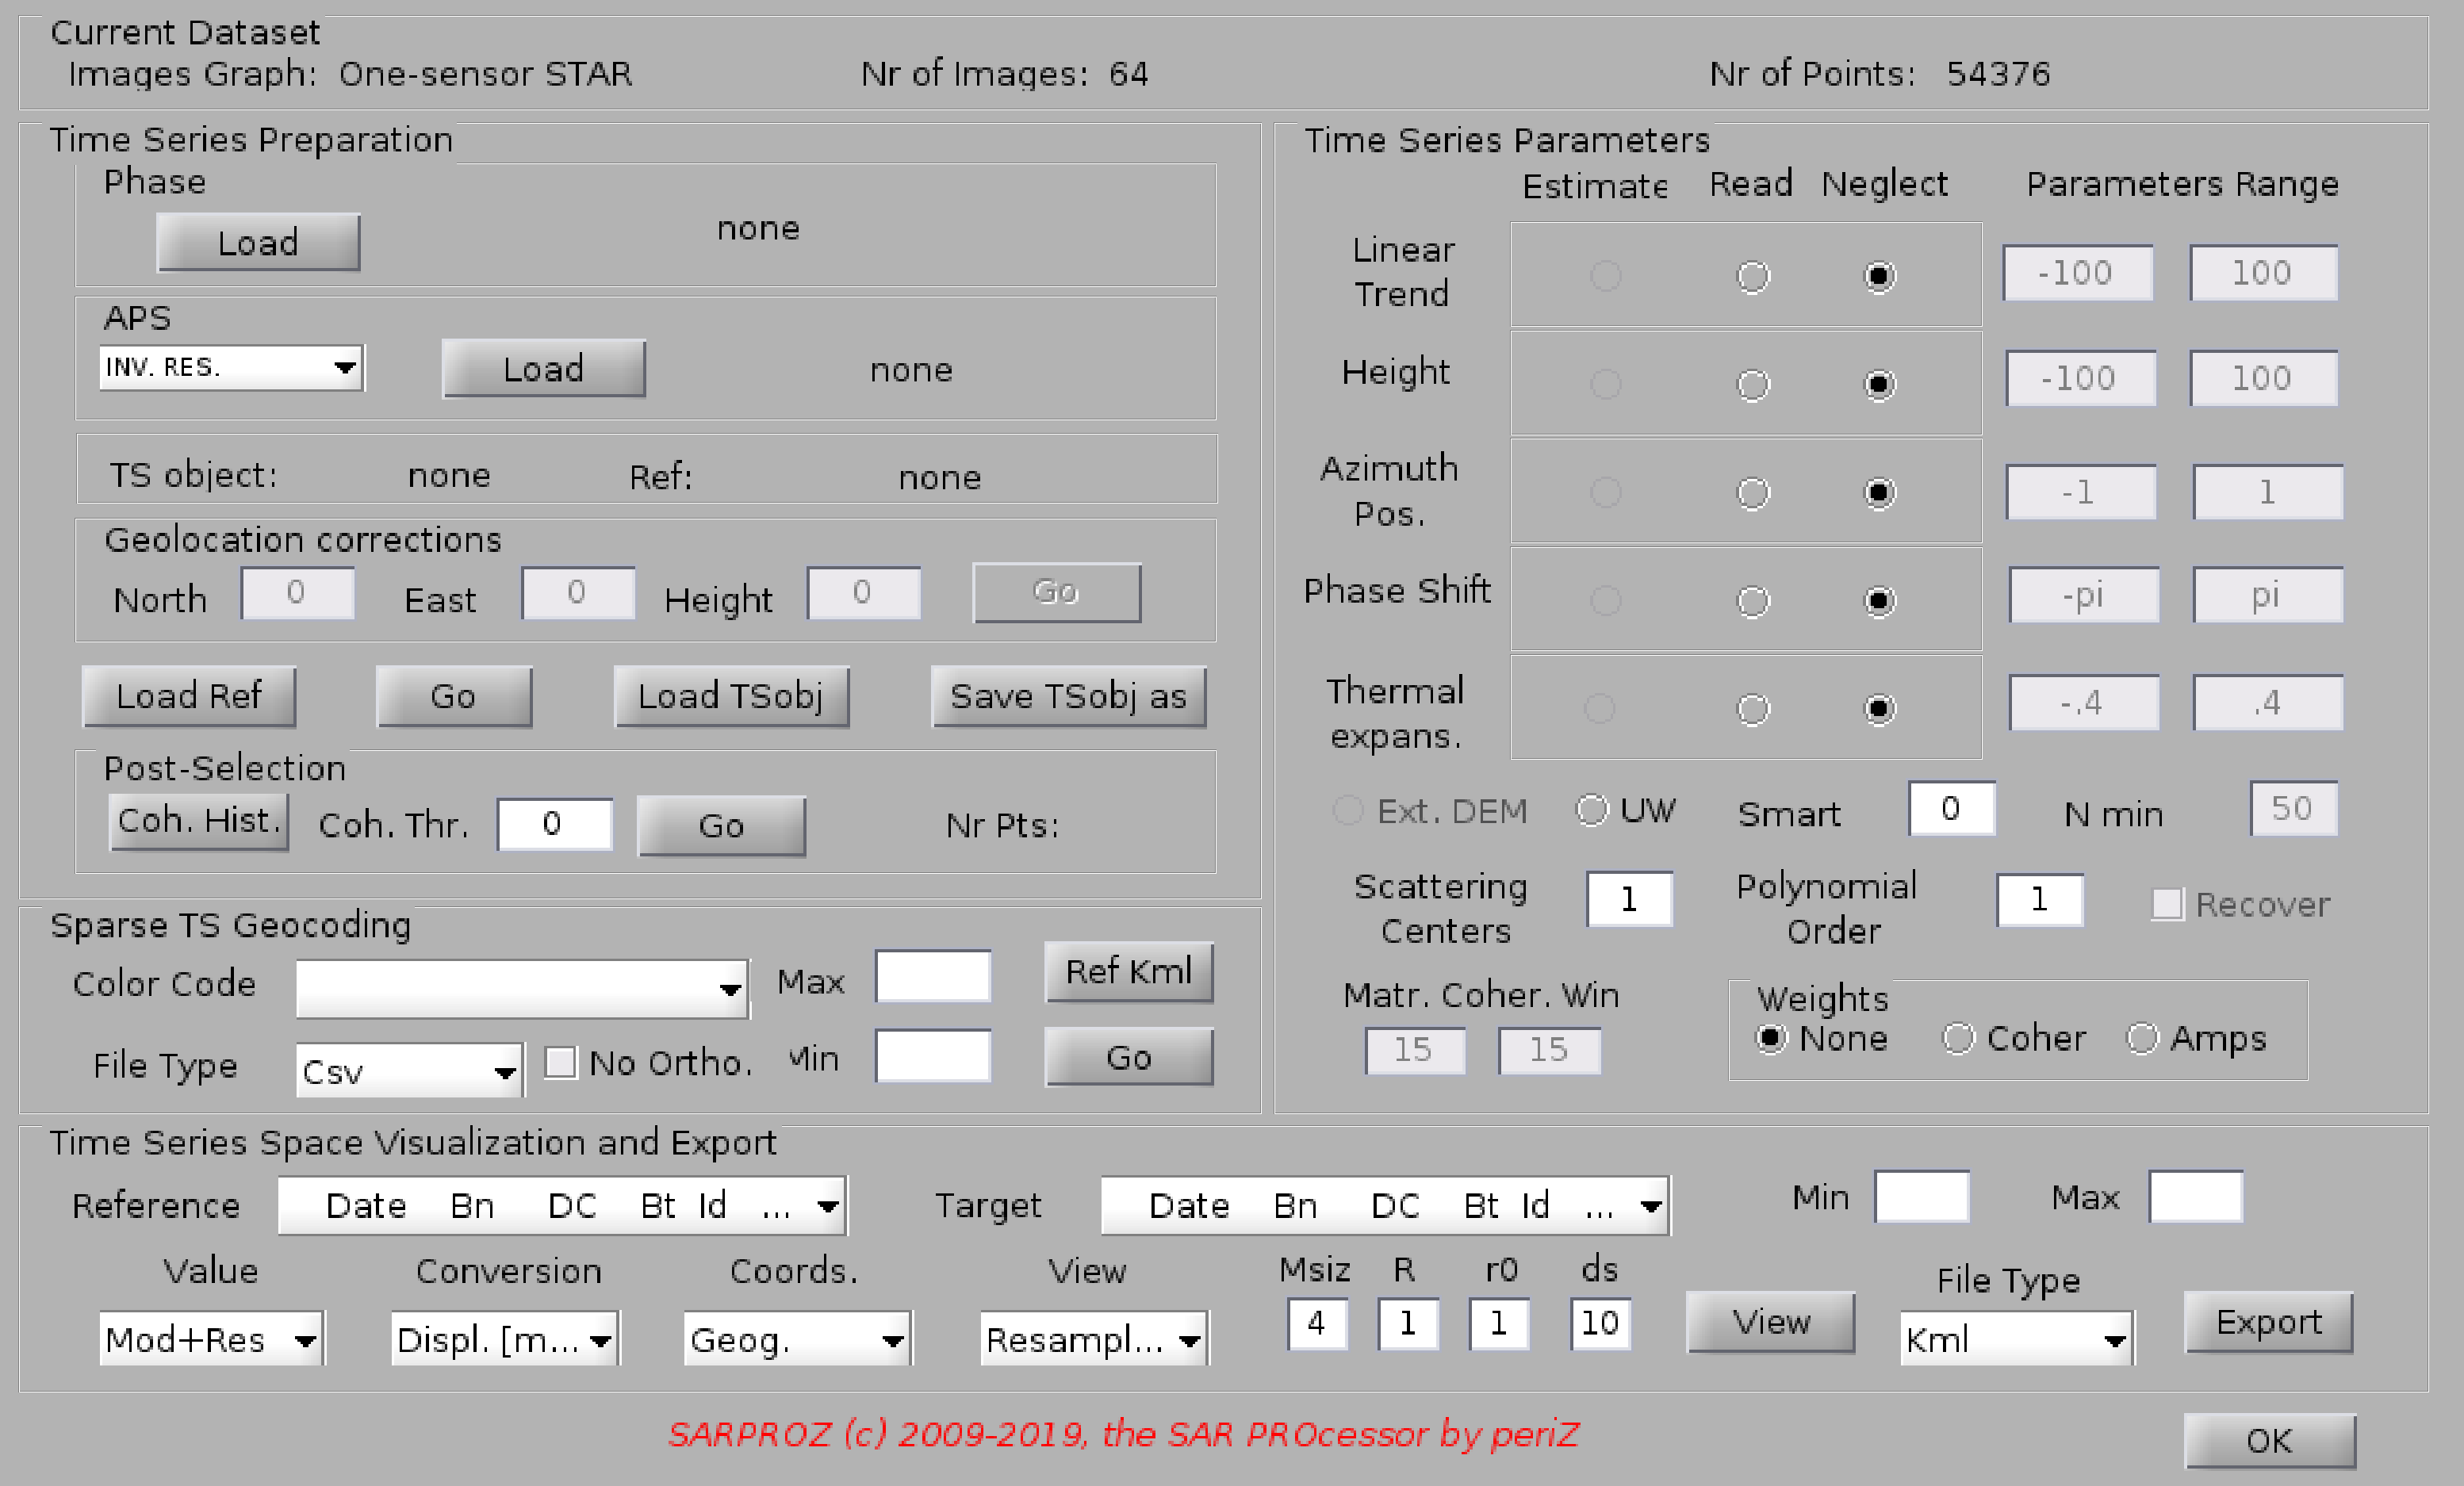
If you previously saved a set of differentials and APS values, you can load them with the corresponding buttons.
If no files are selected, the software will try to automatically load the AutoDiff and AutoAtmo files saved in the MISP module.
The software checks if the saved Diff and Atmo files are compatible with the current dataset options (selection of images,
images graph, number of selected points, APS Type).
If the current dataset options are a sub-selection of the loaded Diff and Atmo files, the software automatically applies a
sub-selection. However, if the current options are not contained in the Diff and Atmo files, data are not loaded.
In case data cannot be loaded, the software reads again Diffs and Atmo from the disk.
Time series can be generated by selecting the corresponding modeling options (velocity/polynomial/seasonal/non-parameteric
and so on), weights, unwrap option and so on.
A reference point can also be chosen, or alternatively the software will load the default one as saved by the APS module.
Once all options are set, you can prepare the time series, which will be automatically saved in a Time Series Object.
It is suggested to save the TS object with a new name to avoid it be overwritten by a future process.
If a TS object was previously created, it can be directly loaded.
BE AWARE: when a previously generated TS object is loaded, all dataset and processing options are changed to match that file.
This is the only module in Sarproz which allows loading data with a different set of images/images graph or with a different
set of points than the current mask selection.
Once a TS object is ready, time series can be exported in a scattered kmz file. This function is the same as the one of the
"sparse geocoding" module. The difference is that in the "sparse geocoding" module no options can be chosen: time series are
exported with the same options selected in the MISP module.
Note the "No Ortho" option: you can choose it if you want to have your points aligned to the geocoded SAR data, without using the
estimated height.
Time series can here be visualized also in space.
In particular, you can see the displacement difference between two images: the target one and the reference one.
You can also choose which values to plot: phase/displacement of data or of the model used in the processing or of the residual
between data and model. Values can be plotted in SAR or geographic coordinates, in matrix or scattered form.
Moreover, data can also be exported in kml/geotiff.