Help for Multi-Sensor Module
This module has been designed for combining data acquired by different sensors with different characteristics/geometries.
The module can import time-series objects previously generated.
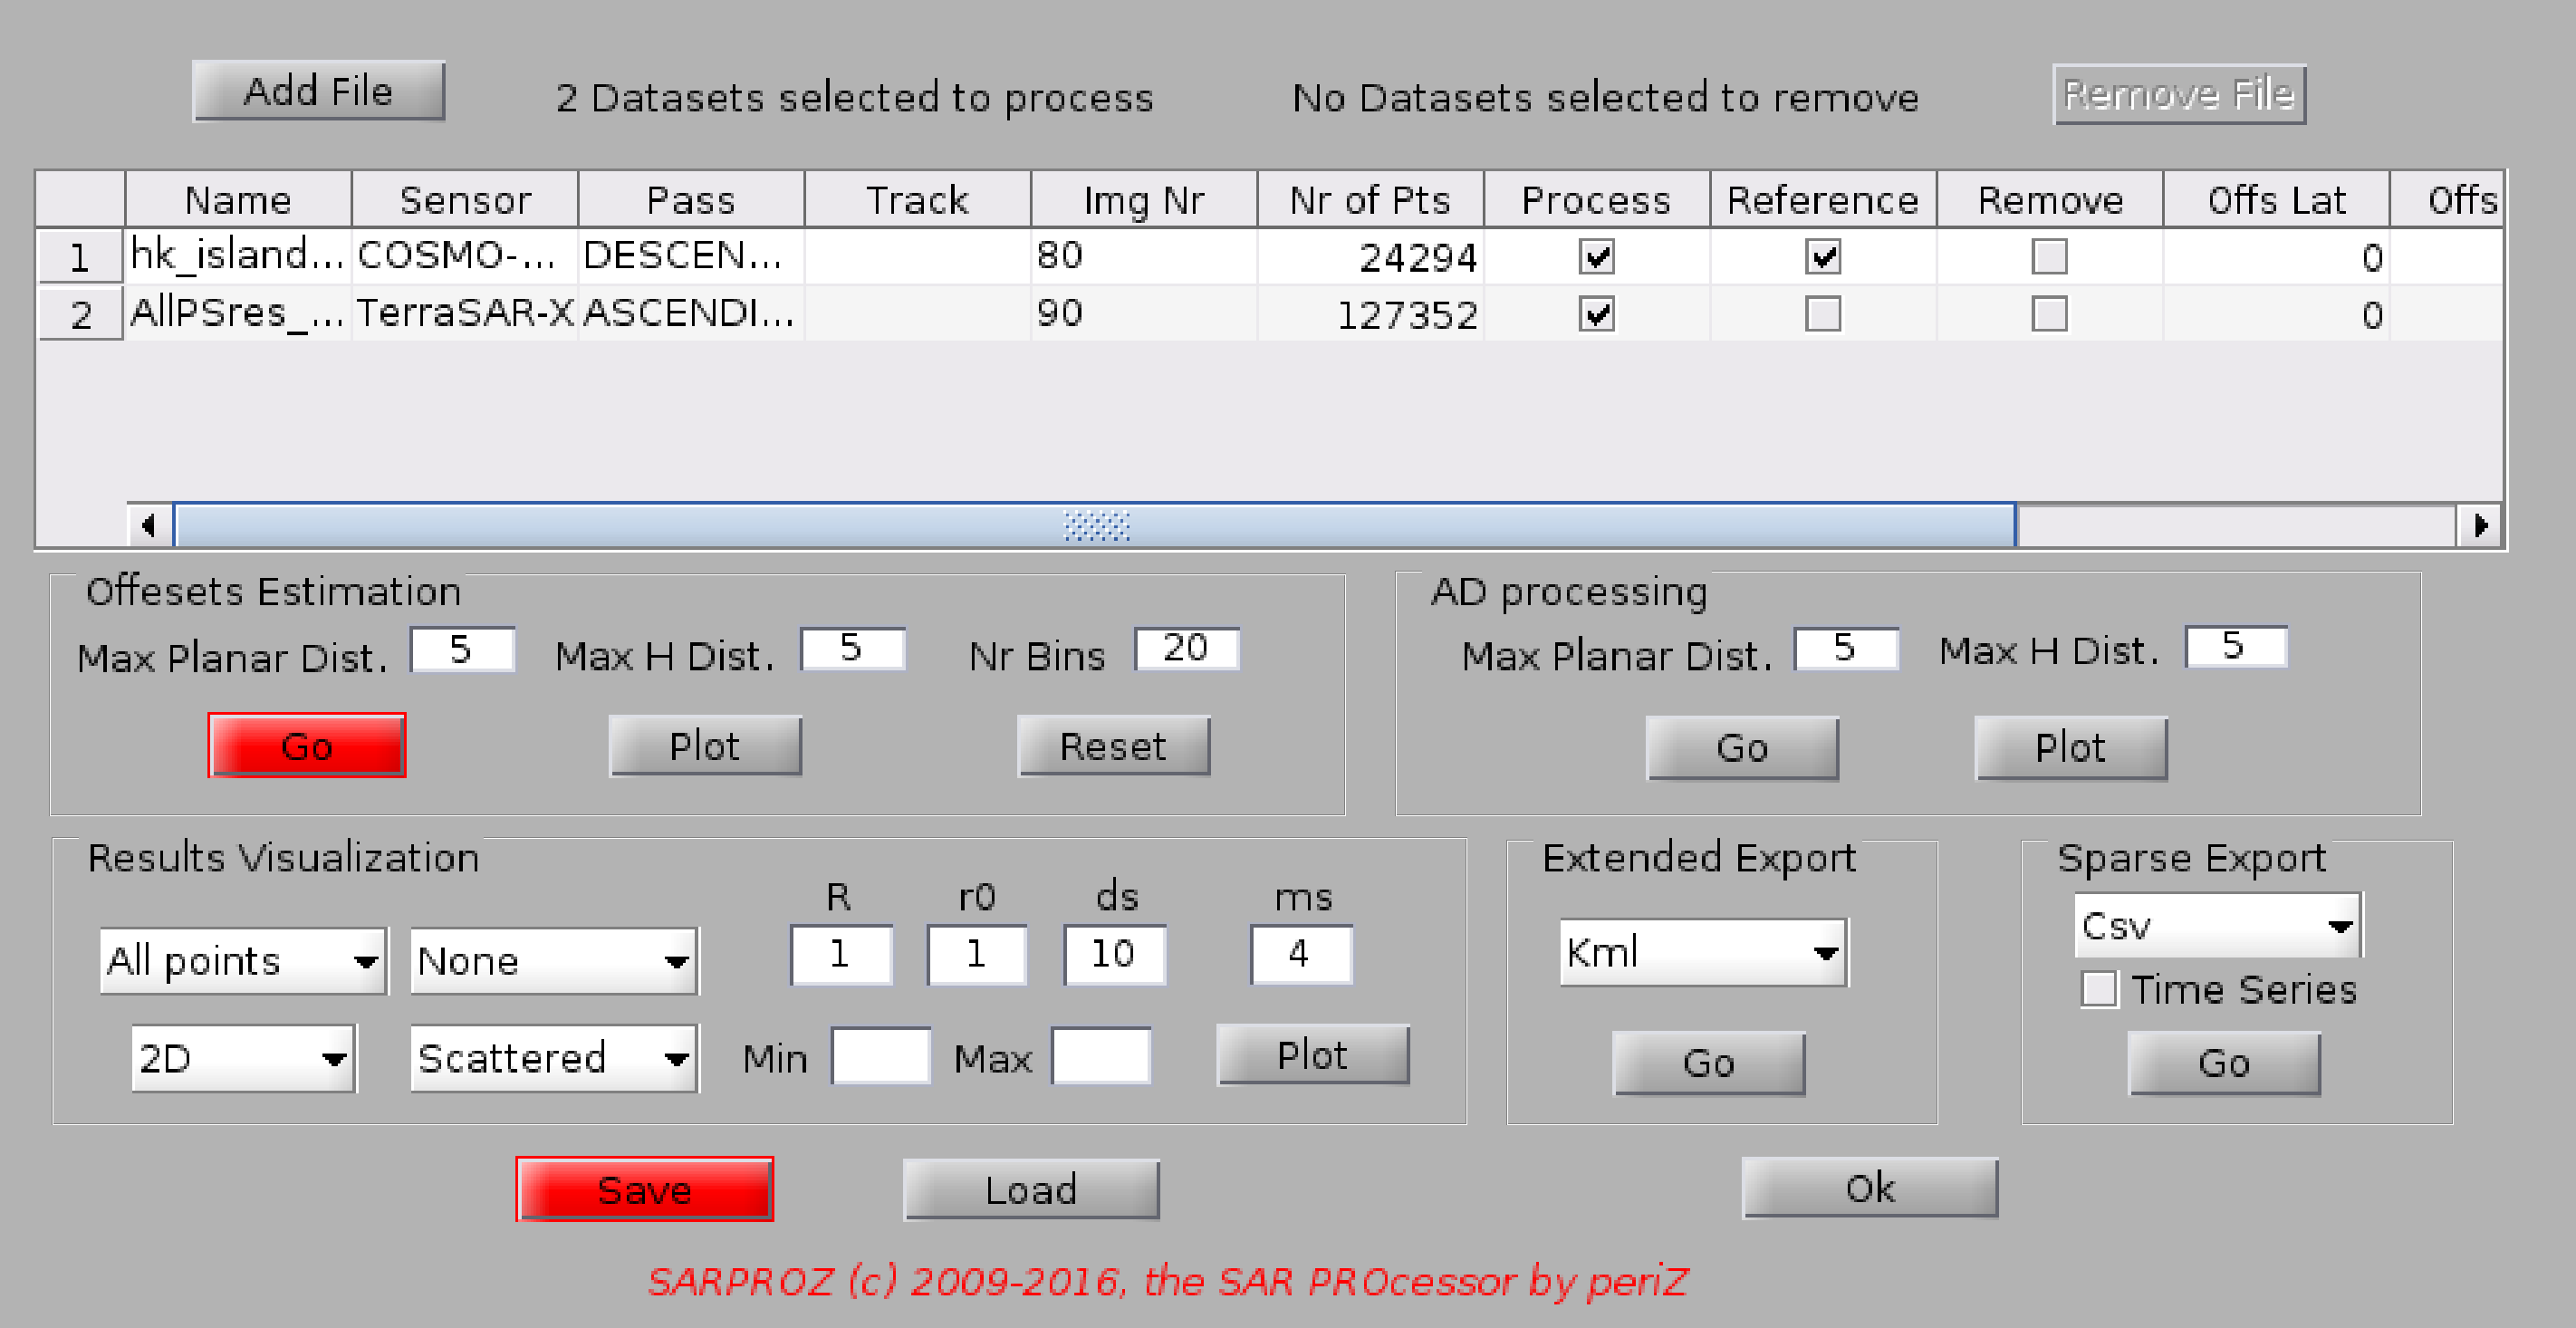
Files can be added to the list of available datasets with the "Add File" button. Datasets can be removed by checking the "Remove" flag
and by clicking on the "Remove File" button.
The Module offers a function to estimate possible shifts between datasets. You need to check the "Process" flag for all datasets involved
in the estimation (at least 2 datasets must be selected). Moreover, you can specify which dataset to take as reference with the corresponding flag.
Precise offsets are estimated using points closer than the range specified in "Max Planar Distance" and Height difference closer than "Max H Dist".
The histograms used in the estimation are based on the number of bins specified in "Nr Bins", and they can be plotted using the "Plot" button.
The Module can also process ascending/descending pairs for decomposing the estimated movement. For doing so, you need firstly to extract
AD pairs with the function in the "AD processing" frame. "Max Planar Distance" and "Max H Dist" are used to indentify the corresponding points
in the two datasets.
Once offsets have been estimated and AD pairs identified (in case of ascending and descending dataset pairs), results can be combined, plotted
and exported. Several options are available. You can plot all points, AD pairs or a grid created on overlapping areas.
You can plot points without additional data or you can create colored plots using velocity/cumulative displacement/height/res. height or coherence.
Moreover, in case of AD pairs you can plot velocity or cumulative displacement projected into vertical or east/west directions.
You can also create 3D plots. Finally, you can decide whether to make scattered plots (ms=dots size) or resampled ones (ds=downsampling,
R=radius, r0=correlation distance). The color range can be constrained within Min/Max by inputing the corresponding values.
Results can be finally exported in extended or sparse formats.